

Traffic
The Traffic tab, Website Traffic Metrics, reports on how visitors find and browse your store, the numbers behind your sales. Open Analytics in the dashboard sidebar and select the Traffic tab.
Like the Sales tab, it has its own controls at the top to set the reporting window:
- Date range. Choose the period the report covers. Available presets are Last 7 days, Last 30 days, and Last 3 months, or pick a custom range.
- Compare. Compare that period against another (for example Previous period), shown as a dashed line on each chart.
Next to the date controls, a Realtime pill shows a green dot with the count of visitors currently on your store — for example "1 active · last 30 min". It updates live while visitors are browsing and disappears after roughly 30 minutes of no activity.
Use it to understand:
- How many people visit your store and how that trends over time.
- Where your visitors come from, so you can see which channels bring traffic.
- How visits turn into orders, which ties back to the Conversion Rate on the Sales tab.
Overview
At the top, a row of headline cards summarises visitor activity for the selected range:
- Site sessions, the total number of visits to your store.
- Unique visitors, the number of distinct people behind those sessions.
- Avg session duration, the average time a visitor spends per session
(shown as minutes:seconds). This stays at
0:00until visitors browse more than one page in a session — a session that only views the landing page won't contribute meaningful duration data. - Pages / session, the average number of pages viewed per session.
- Bounce rate, the share of sessions that left after viewing a single page.
- Conversions, how many sessions ended in an order.
- Conversion rate, the share of sessions that converted
(
Conversions ÷ Site sessions).
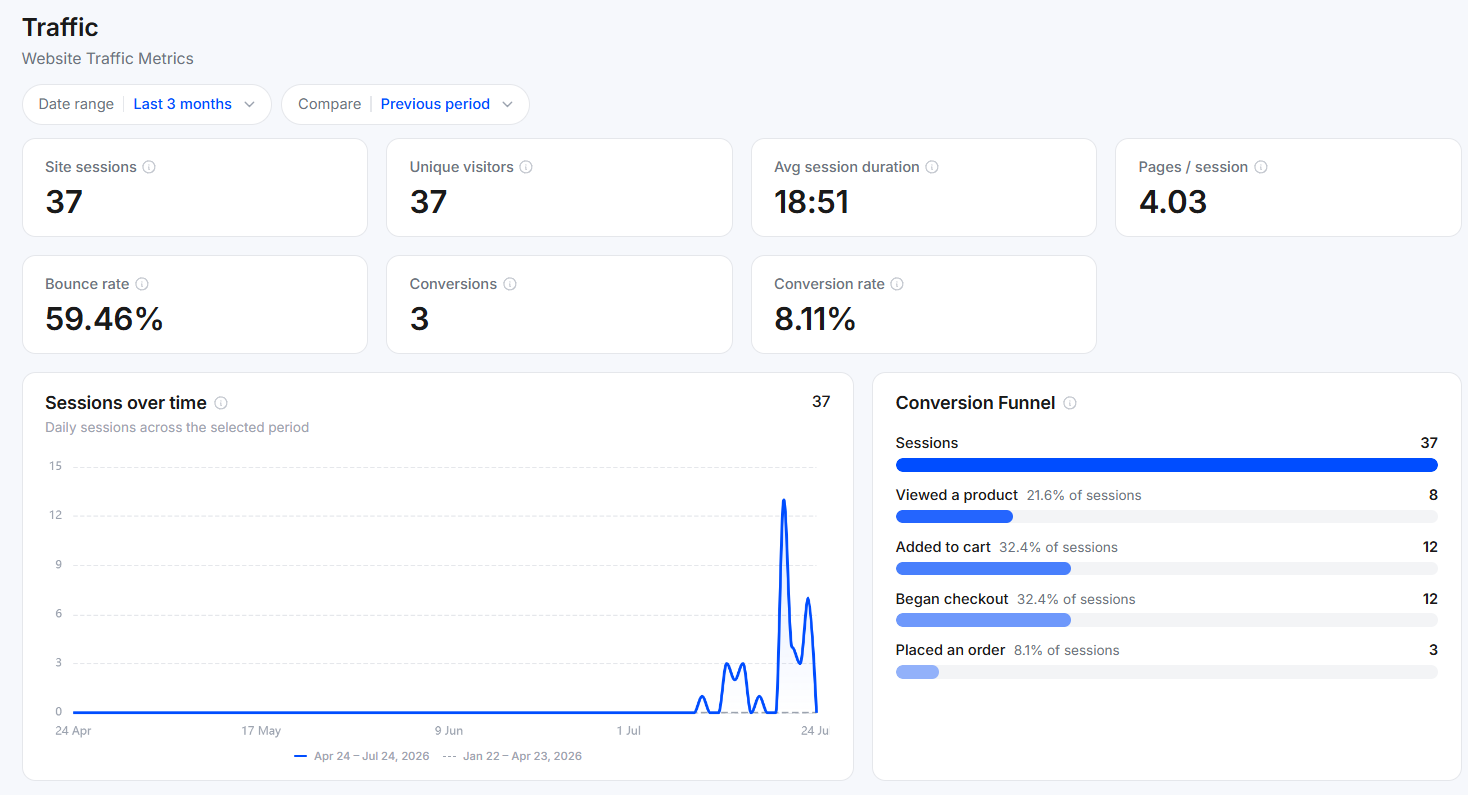
Below the cards, two panels chart how visits happen and where they drop off:
- Sessions over time. Daily sessions across the selected period, plotted as a line for the current period against a dashed line for the comparison period.
- Conversion Funnel. The path from arrival to order, step by step — Sessions → Viewed a product → Added to cart → Began checkout → Placed an order — each with its count and its share of sessions. Each stage should be less than or equal to the stage before it. Read the drop between steps to spot where visitors leave before buying.
Acquisition
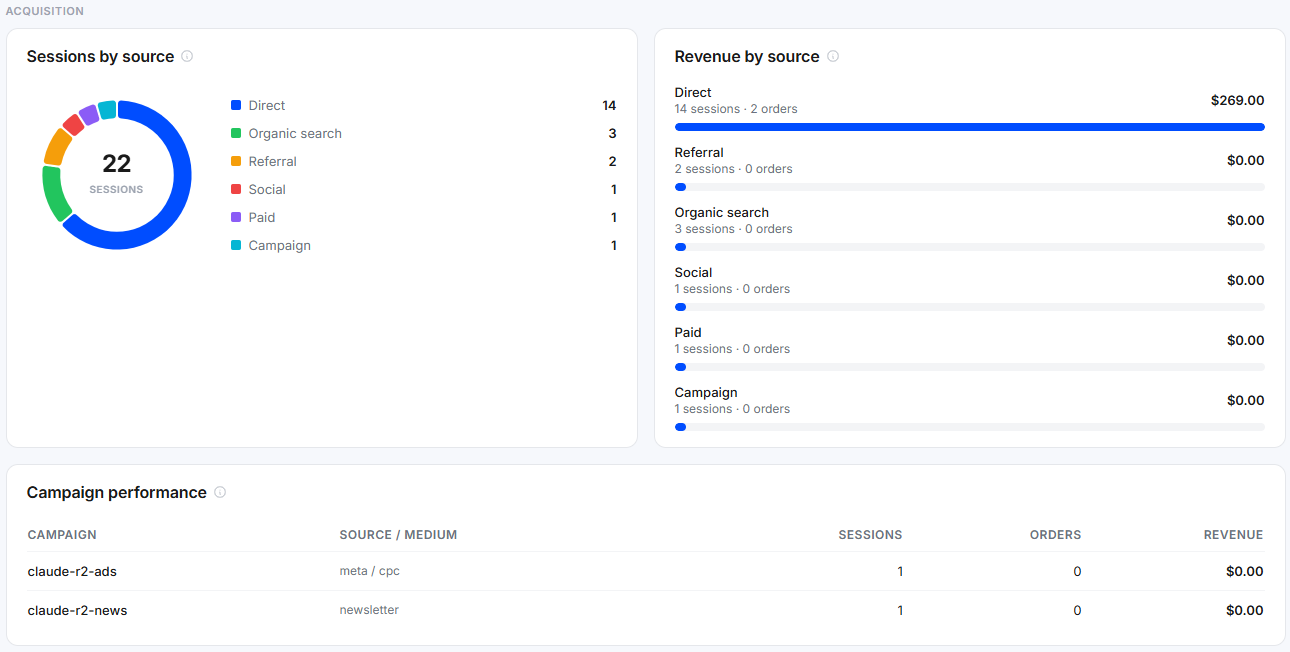
This section shows where your traffic comes from and which channels earn revenue:
- Sessions by source. A donut chart of sessions split by channel — Direct, Organic search, Referral, Social, Paid, and Campaign — with each channel's session count listed beside it.
- Revenue by source. The same channels ranked by revenue, each showing its
sessions, orders, and total earned, with a bar showing relative
contribution. A channel can drive sessions without driving revenue (for example
many sessions but
$0.00and 0 orders). - Campaign performance. A table of your tracked campaigns, each with its source / medium (for example meta / cpc or newsletter), sessions, orders, and revenue — so you can see which campaigns actually paid off.
Behavior
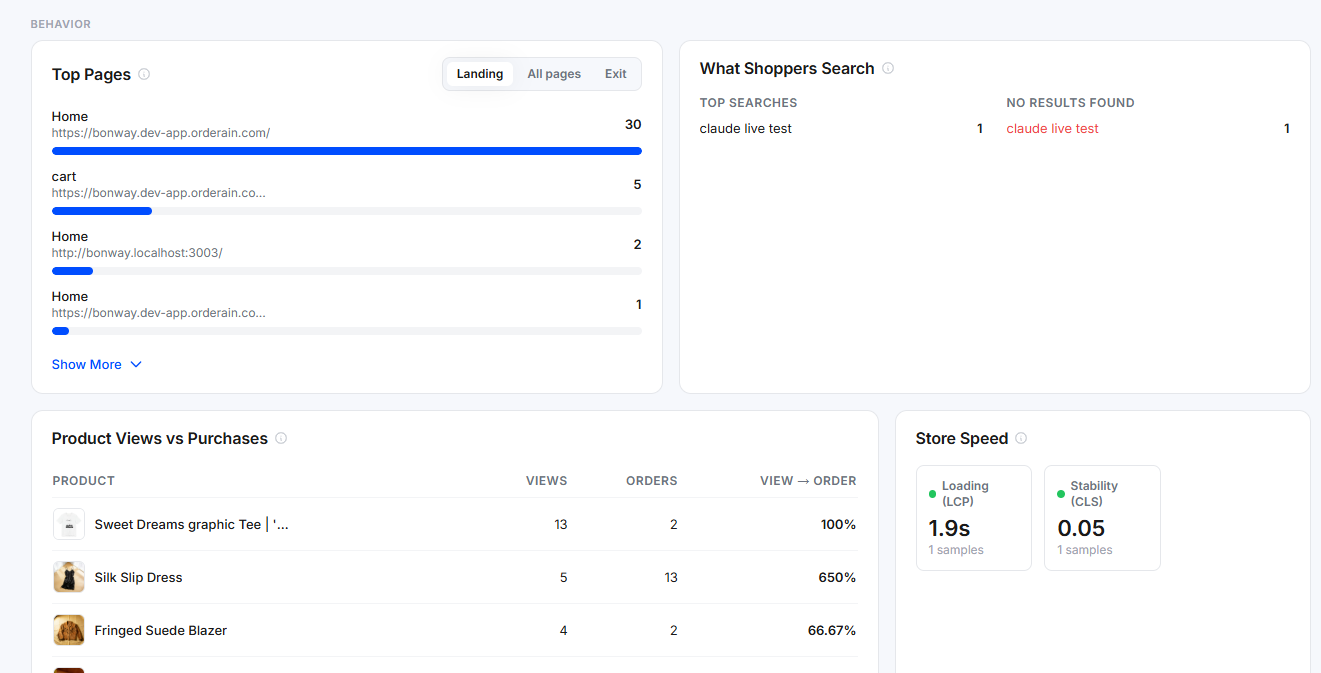
This section shows which pages visitors land on and what they search for:
- Top Pages. Your most-visited pages, each with its URL and visit count and a bar showing relative traffic. Toggle between Landing (where sessions start), All pages, and Exit (where sessions end), and use Show More to expand the list.
- What Shoppers Search. Two lists side by side — Top searches, the terms visitors search for most, and No results found, searches that returned nothing (flagged in red). The "no results" list points to products shoppers want but can't find.
Product views vs purchases
This section pairs how products get discovered with how fast your store loads:
- Product Views vs Purchases. A table of products with their views, orders, and a View → Order rate. The rate can exceed 100% because orders and views are counted over the same window but don't have to come from the same sessions — a product with few views but many orders (repeat buyers, or cart adds without a product-page visit) will show a high percentage.
- Store Speed. Three performance signals sampled from real visits — Loading (LCP), how quickly the main content appears, Interactivity, how quickly the page responds to a visitor's first click or tap, and Stability (CLS), how much the layout shifts while loading. Each shows its value, a sample count, and a colored dot for its health (green is good).
Audience
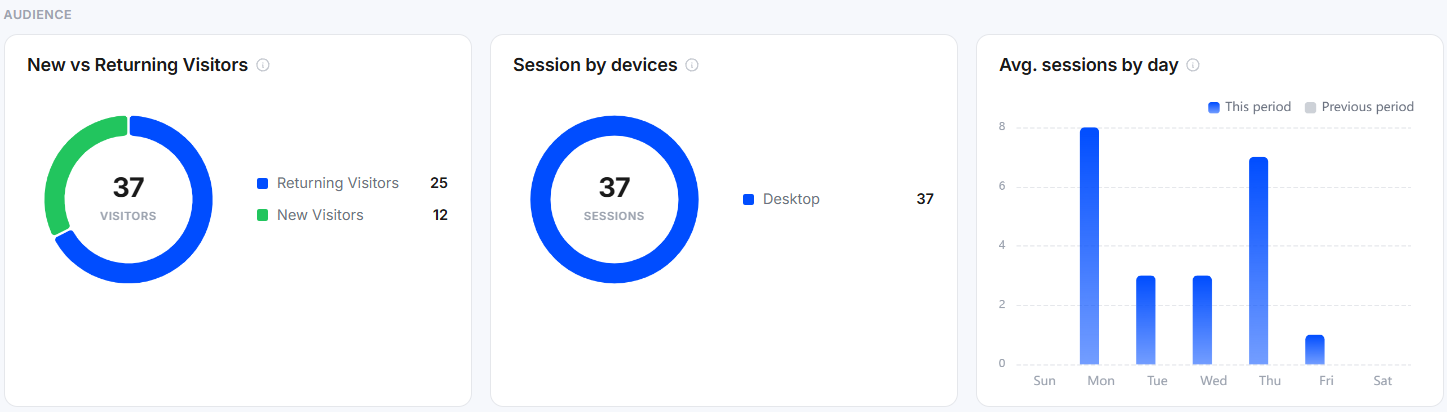
This section describes who your visitors are and where and when they visit:
- New vs Returning Visitors. A donut splitting visitors into those who came back and those visiting for the first time.
- Session by devices. A donut of sessions by device type (for example Desktop, Mobile, Tablet).
- Avg. sessions by day. A bar chart of average sessions per weekday, comparing this period against the previous one, so you can see which days draw the most traffic.
- Sessions by location. A world map highlighting where sessions come from, with the top country called out, followed by a Top cities list ranking cities by session count.
Interactive elements
| Element | Where | Action |
|---|---|---|
| Realtime pill | Top of page, next to date controls | Shows live count of active visitors ("N active · last 30 min") |
| Landing / All pages / Exit | Top Pages | Switches the list between where sessions start, all pages viewed, and where they end |
| Show More | Top Pages | Expands the list of pages |
| ⓘ icon | Every card title | Hover for a plain-language explanation of that metric |
| Compare toggle | Top controls | Turns on the previous-period dashed line on each chart |