

Analytics
Sales
The Sales report is the full breakdown of your store's revenue, dig into what you're selling, where and how customers buy, and what you're keeping or losing.
The Sales tab, Revenue Performance Analytics, is the full breakdown of your store's revenue. Open Analytics in the dashboard sidebar and select the Sales tab.
Sales is read-only reporting, it turns your store's activity into charts and
numbers so you can spot trends, best sellers, and where you're losing sales.
Use the controls at the top to set the reporting window:
- Date range. Choose the period the report covers. Available presets are Last 7 days, Last 30 days, and Last 3 months, or pick a custom range.
- Compare. Compare that period against another (for example Previous period), shown as a dashed line on each chart, with a delta value on tiles where a previous-period comparison exists.
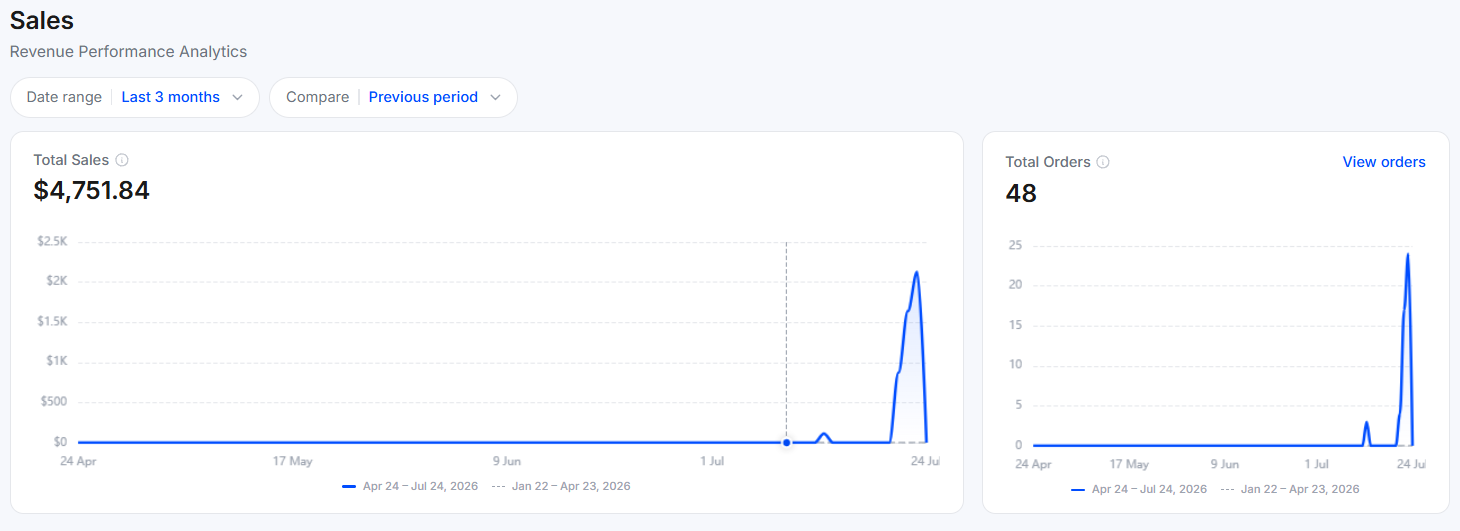
If a period has no orders, cards still render — showing $0.00 or 0 —
rather than being hidden. An empty-looking card means no activity in that
window, not a broken report.
Totals
At the top, two headline cards show your revenue and volume for the selected range:
- Total Sales, your total revenue over the period.
- Total Orders, how many orders were placed. Click View orders to jump to the Orders page.
Each card plots a trend line for the current period against a dashed line for the comparison period.
Total Sales is the report's single source of truth. Sales by Categories,
Top Products, Sales By Location, and Sales by Payment Method are four
independent breakdowns of the same revenue — each one, added up, should equal
the Total Sales headline exactly. If any of them disagree, there is a
data-integrity issue upstream (attribution, storage, or calculation), not just a
display bug.
Performance
A row of performance cards breaks your results down further, each with its own trend chart:
- Average Order Value, the average amount spent per order.
Calculated as
Total Sales ÷ Total Orders. - Online Store Conversion Rate, the share of visits that turned into orders.
- Returning Customer Rate, the share of orders from customers who came back (i.e. had ordered before, in this store's history).
- Units Sold, the total number of items sold across all orders. Cancelled or rejected orders are excluded.
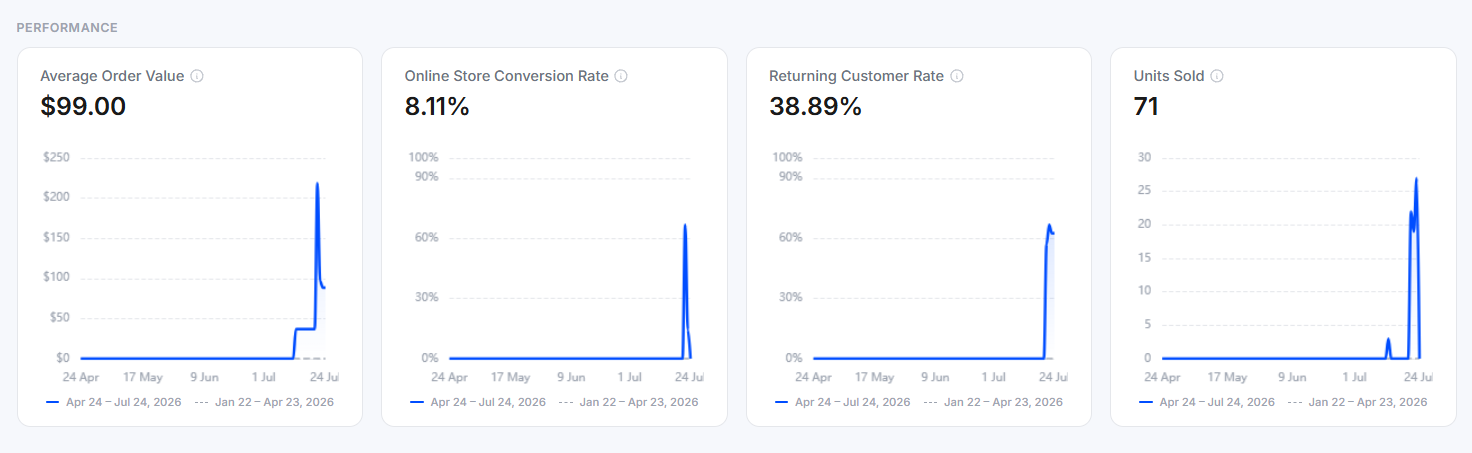
As a sanity check, Average Order Value × Total Orders should be approximately
equal to Total Sales.
What sells
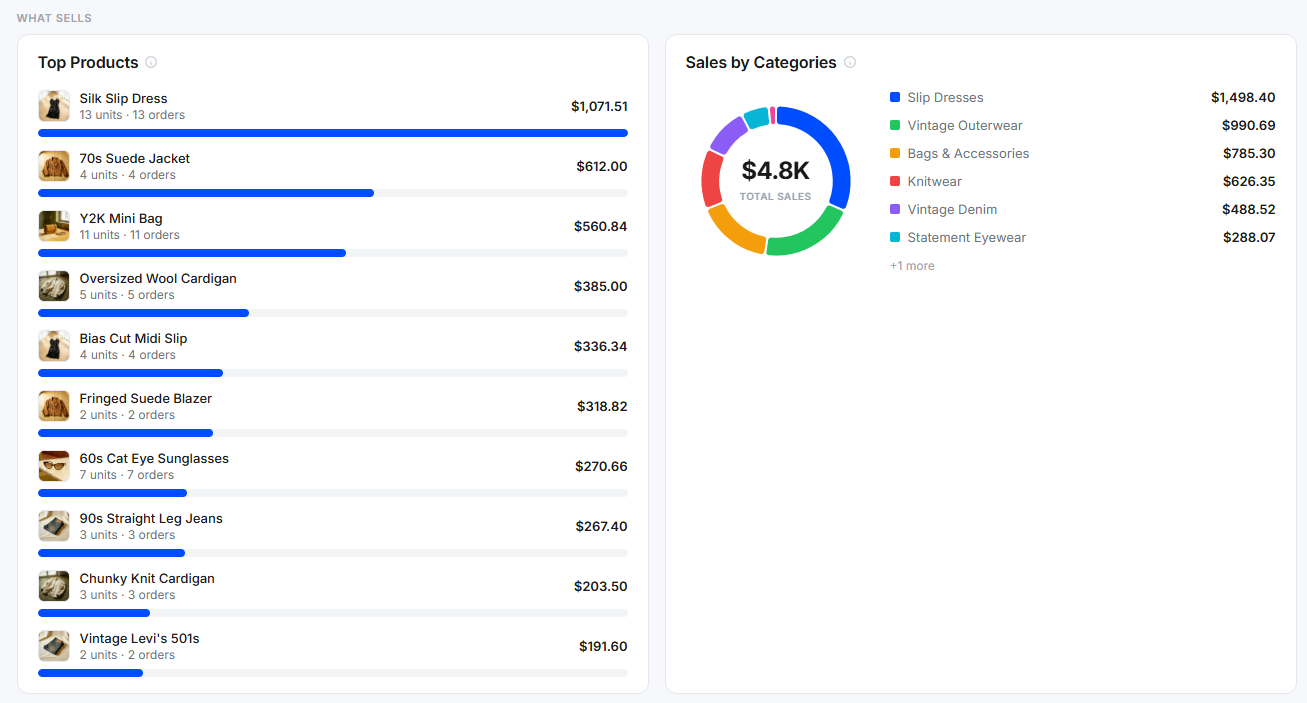
This section shows which products and categories drive your sales:
- Top Products. Your best-selling products ranked by revenue, each with its image, units and orders, a progress bar showing relative performance, and the total amount it earned. The progress bar is relative, not absolute — it's scaled against the top-selling product's revenue (that product's bar is 100% full; others are shown as a percentage of it).
- Sales by Categories. A donut chart of total sales split by product category, with the top categories and their amounts listed beside it. A + N more label shows how many categories aren't listed, but doesn't expand into a full list — instead, hover a donut segment to see that category's name, amount, and percentage share.
Where & how customers buy
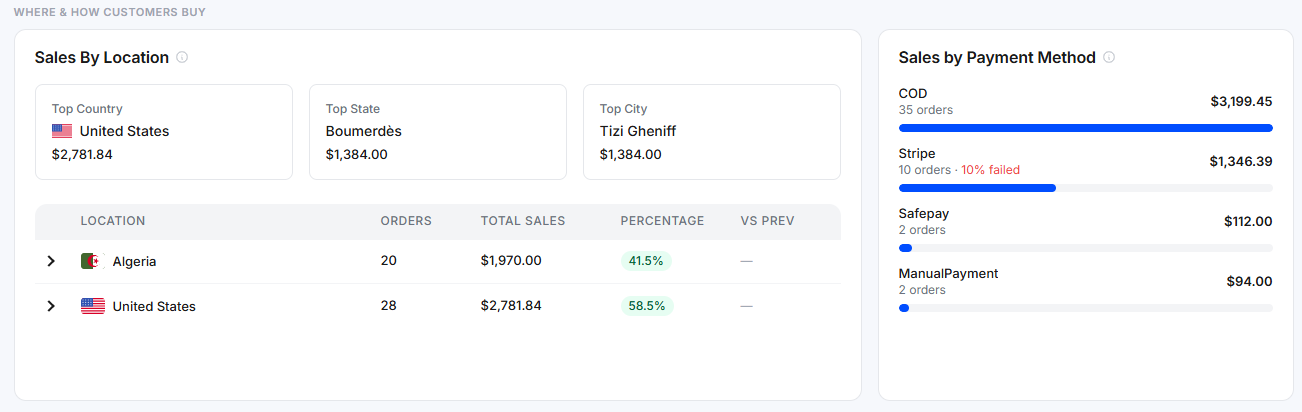
This section maps where your customers are and how they pay:
- Sales By Location. Highlights your Top Country, Top State, and Top City by revenue, followed by a table breaking sales down by location, each with its orders, total sales, percentage share, and change vs the previous period. Expand a row (›) to drill into that location — for example, expanding a country reveals its states/cities with the same orders/sales/percentage columns.
- Sales by Payment Method. Total sales by payment method — COD, Stripe,
PayPal, Safepay, RazorPay, and Manual Payment — each with its
order count and a bar showing its share. Any failed payments are flagged
in red (for example 20% failed), calculated as
failed orders ÷ total orders for that method. Failed/cancelled orders count toward this order total but their revenue is excluded from Total Sales.
Kept vs lost
The last section shows the revenue you held on to and the revenue you lost:
- Lost Revenue. Money you didn't capture, for example rejected or
cancelled orders, shown as an amount, order count, and its share of order
value (
lost amount ÷ total order value including lost orders). - Coupon Impact. How discounts affected your sales: orders using a coupon (and their share of all orders, e.g. 1 of 4 (25%)), the total discounts given, and the revenue from couponed orders (the amount actually earned after the discount was applied).
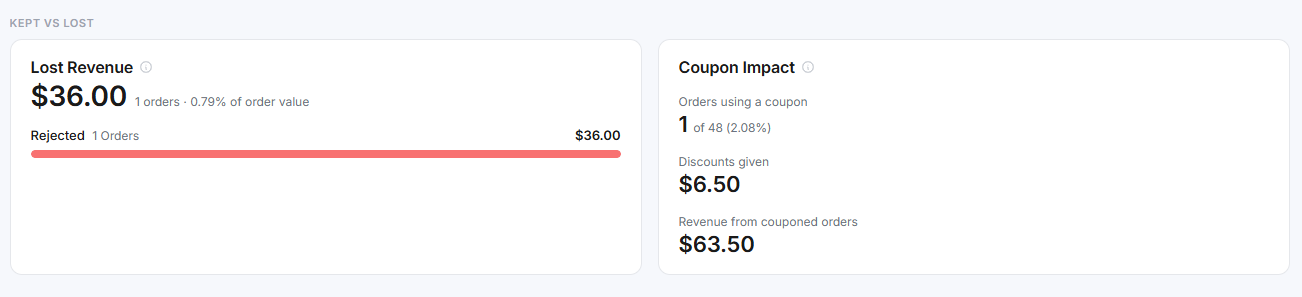
Use Coupon Impact alongside Lost Revenue to check whether your discounts
are bringing in more revenue than they give away.
Interactive elements
| Element | Where | Action |
|---|---|---|
| View orders | Total Orders card | Jumps to the Orders page |
| + N more | Sales by Categories | Label showing how many categories aren't listed (not clickable) |
| Hover a donut segment | Sales by Categories | Shows that category's name, amount, and percentage share |
| › | Sales By Location table | Drills a row down into that location's states/cities |
| ⓘ icon | Every card title | Hover for a plain-language explanation of that metric |
| Compare toggle | Top controls | Turns on the previous-period dashed line and delta values |
Every card carries an ⓘ icon next to its title — hovering it always shows a
short, plain-language explanation of what that specific card measures.